Read the market shift before consensus does.
Consensus reacts after the event — after the drawdown, the panic, and the rebound.
Average 84% validated prediction signal precision across the S&P 500 cycle.1
RegimeSignal™ was engineered to predict the S&P 500's full market cycle. Its multi-signal framework is designed to flag forming bear regimes, correction landmines, the panic, and the rebound — before they become consensus. The same regime intelligence extends to equity sector calls, global index drawdown alerts, and individual stock calls — so you see the full picture, not just the index.
To our knowledge (public-market review, June 2026), it's the only publicly documented commercial framework reporting per-signal forward precision across a full-cycle regime taxonomy with this validation.
Not hindsight. Not lagging indicators. Forward-looking market regime intelligence.
Institutional-grade · made available to everyone
15-minute preview: no credit card, signup or download. | 7-day trial: card required, cancel anytime.
Available on desktop, laptop, tablet & mobile — any browser, no download required.
Click to view:PhD Validation·PhD Audit·Developed by Economics/MBA/CFA Charterholder
Market change signal — Each dot below is a real signal fire on the S&P 500. The arrow shows what happened next.
This is the model's track record — not a forecast, the receipts.
Dated snapshot · not live— for current reads see the Market Terminal below
Illustrative chart shape until backend serves real fire dates · all precisions, counts, and OOS windows above are locked and real.
~84%
Average precision on historical validation across BRS, MBS T1, MBS T2, RRS
~4%
Aggregate false-positive rate
~4 mo
Average forward window
Regular
Walk-forward refit cadence
Walk-forward validated · S&P 500 · HybridBrain™
Validated signal precision
Approximately 84% validated signal precision across the S&P 500 cycle.1
RegimeSignal™ calls the full S&P 500 cycle — pullbacks, corrections, bear regimes, and recoveries — months ahead, averaging ~84% out-of-sample precision across its four signals: bear-market detection (BRS) ~86%, pullback forecasts (MBS T1) ~83%, correction forecasts (MBS T2) ~84%, and recovery confirmation (RRS) ~82%2 — walk-forward validated and independently PhD-validated & audited.
To our knowledge (public-market review, June 2026), it's the only publicly documented commercial framework reporting per-signal forward precision across a full-cycle regime taxonomy with this validation.
What it's for
A full-cycle early market warning system.
One purpose, four jobs. Below is what RegimeSignal™ is built to do — the signals that power each job come right after.
Anticipate
Read forming bear regimes well before they reach consensus.
Observe
Frame pullbacks, drawdowns, and weakening internals while they're still forming.
Re-engage
Confirm bull recoveries with conviction — not on the headline bounce.
Filter
Separate routine noise from regime-level structural change.
The data engine
Most market calls run on opinion. Ours runs on the economy itself.
Every signal RegimeSignal™ fires is built from live, authoritative data — not pundit instinct, not a backtested guess frozen in time. The model reads the same 24 Federal Reserve economic series that move policy, refreshed every market day, and fuses them with real-time price, breadth, sentiment, and news.
24
Live FRED economic series
30+
Total live data streams
Daily
Refresh cadence, every market day
1987
Sentiment history depth (AAII)
Yield curve · CPI & core inflation · credit spreads · payrolls · Fed balance sheet · industrial production · jobless claims · housing · money supply — plus live equity, volatility, breadth, fear/greed, and AI-scored news flow.
When the economy shifts, the model sees it in the data — often weeks before the headlines admit it.
The signals
Four validated models. One complete-cycle foresight engine for the S&P 500.
Each signal is independently constructed and walk-forward validated. Together with Bull Velocity and Bear Velocity, they cover the full S&P 500 cycle — from pullback warning to bear regime to confirmed recovery.
BRS
Bear Regime Signal™
86%¹
Precision when fires
Sees bear markets coming as they form — not after the damage is done. Fires Bear Alerts as the early warning layer for −20% regime risk.
Bear Alert · regime classifier
MBS T1
Market Break Signal — Tier 1
83%²
Precision when fires
Calls −5% pullbacks ahead of the move and triggers the Neutral state — a tactical heads-up before the dip.
Pullback · −5% · Neutral state trigger
MBS T2
Market Break Signal — Tier 2
84%³
Precision when fires
Calls −10% corrections four months ahead — the kind that actually hurt — and hands off to BRS when conditions deepen toward bear.
Correction · −10% · Underperform trigger
RRS
Regime Recovery Signal™
82%⁴ †
Precision when fires
Calls bull-market recovery (+10%) ahead. Stays silent during fake-out rallies, speaks up when the bull is real — the high-conviction recovery confirmation, historically associated with durable bull recoveries.
Recovery · +10% confirmation
Directional gauges only5 — not state triggers; excluded from the 4-signal aggregate due to statistical thinness, disclosed honestly. Useful as supporting context; their contribution to the composite score diminishes as signals decay over time.
Bull Velocity Rating
BWS engineWithin-bull weakening score — watches floorboards creak before the house comes down. 87% within-bull precision across 47 OOS months but AUC 0.67 with N=14 negatives — confirmatory only, not a fire signal.
Bear Velocity Rating
BES engineWithin-bear directional gauge tracking bear-to-recovery transitions. Often precedes RRS by weeks during recovery turns. 21 LOO-CV samples (COVID-dominated) — not walk-forward validated; confirmation only, never a fire signal.
Bull Health Tracker
BHT · descriptive0–100 descriptive companion to Bull Velocity, calibrated against 33 years of bull history (310 clean bull months 1993–2026). Second lens on the same evidence — 60 ≈ historical bull low, 90 ≈ historical bull peak.
Pullback Resolution Gauge
PRG · Neutral companionWithin-Neutral directional gauge — measures which way a Neutral state is resolving. Composite of MBS T1, MBS T2, BRS distance-to-bear, and daily news flow. Components walk-forward validated; composite weighting is not. Confirmatory only.
Recovery Durability Gauge
RDG · Recovery companionWithin-Recovery directional gauge — distinguishes durable returns from bear-market rallies. Composite of RRS, Bear Velocity slope, BRS exit, price vs. 200-day MA, and credit spreads. Components walk-forward validated; composite weighting is not.
Beyond the index
Full-cycle forecasts are the core. They are not the whole coverage.
The four validated S&P 500 models anchor the platform — but the same regime intelligence extends outward to equity sectors, global indices, and individual stocks, so you see where risk is concentrating, not just that it exists.
S&P 500 Year-End Call
7,892 – 8,542. 70.6% historical frequency across seventeen comparable years. A fixed probability range for the S&P 500 calendar-year close, struck from the August 4, 2026 close of 7,737 and built from historically comparable years. Not a price target, not a forecast of any particular outcome, and not a trading signal. Shown alongside live earnings, valuation and margin data from FactSet.
Historical frequency across seventeen comparable years, not a price target. Confidence interval 46.9%–86.7%. Not part of the validated model layer.
Calendar-year close · probability range
Sector Prediction
Which sectors break first. The same regime engine applied to S&P 500 sector ETFs — flagging sector-level drawdown risk while the index still looks calm. Sectors that don't clear the modeling bar are shown as not modelled rather than guessed at.
Equity sectors · drawdown calls
Global Index Calls
Risk doesn't stop at the S&P 500. Regime reads on major global and thematic indices, surfacing drawdown alerts abroad — often the first tell that stress is spreading rather than staying local.
Global indices · drawdown alerts
Offense Calls
The other side of the question. Every other layer answers when to step back; this one asks when the odds favor leaning in — a separate model on the same factor panel, measured against both a naive always-yes baseline and a scrambled-answer control. Informational research output, not a validated signal.
Upside conditions · four-month window
Stock Calls
Name-level reads, same discipline. Individual stock calls framed by the prevailing market regime, so a single-name view is never read in isolation from the cycle it sits inside.
Individual names · regime context
Sector, global index, and stock calls are research context delivered in the platform terminals. They are not part of the four-signal validated aggregate and carry their own disclosures. See the terminals →
About the S&P 500 year-end range
The 7,892 – 8,542 range is a frequency statement about seventeen historically comparable years. It is struck from the S&P 500 close of 7,737 on August 4, 2026, and it is a fixed call — it is not re-based as the market moves. It is not a price target, not a forecast of any particular outcome, and not a trading signal.
Twelve of those seventeen years finished inside the band, which is where the 70.6% figure comes from. Seventeen is a small sample: a single year moving in or out of the band shifts that figure by roughly six points, and the 95% confidence interval around it runs from 46.9% to 86.7%. The three conditions that define the comparison group were selected after examining the data — eleven were tested — and once corrected for that search, the result carries a family-wise p-value of 0.410. On that basis the range is suggestive, not statistically established. No untouched holdout has confirmed it.
A wider band would be easier to be right about. A zero-factor band drawn to capture 70% of all years is 14.3 percentage points wide, has a floor below zero, and actually held more often against this same group of years. The published range is 8.4 points wide with a floor above zero. It is not more accurate than doing nothing — it is more precise at a stated confidence, and it takes a position.
This range is not part of the validated model layer. The four RegimeSignal classifiers — BRS, MBS T1, MBS T2 and RRS — are walk-forward validated over 304 out-of-sample months, independently reviewed under the PhD Statistical Validation and PhD Audit engagements, and covered by the software integrity attestation. None of that applies to this range. It carries no fire threshold, triggers no alert, and is deliberately excluded from the signal track record so that the audited figures remain audited figures. Where the range and the classifiers disagree, the classifiers are the validated work.
RegimeSignal™ is a market-intelligence data software product owned by Cronus Market Intelligence, LLC, a Delaware limited liability company. Cronus Market Intelligence, LLC is not a registered investment adviser, broker-dealer, or financial advisor. The signals, analysis, and content provided are for informational and educational purposes only and do not constitute investment advice, an offer to sell or solicitation to buy any security, or a recommendation regarding any specific investment strategy.
All results reflect historical walk-forward out-of-sample testing on the S&P 500. Past market signal record does not guarantee future results. No representation is being made that any account will or is likely to achieve profits or losses similar to those shown. Subscribers should consult with a qualified financial professional before making any investment decisions.
Inside the platform
The market's condition, measured — and stated in advance.
RegimeSignal™ publishes a current read on the S&P 500 market cycle, forward probability ranges measured against decades of market history, and independent evidence on any US-listed stock. Every figure names its basis and the date it was measured on.
Walk-forward validated out of sample · Computed on our own servers from our own daily bars · Every figure dated and sourced · A publisher of research, not an adviser
RegimeSignal™ organizes its live platform into seven Market Terminals, Market Calls, Analytics, Model Consensus, Composite Score and News. It publishes a current read on the market cycle, conditional base-rate research and per-security evidence screens — all computed on our own models from public market data, refreshed continuously, and every figure carrying its basis.
It is a publisher of research. It is not an investment adviser, it does not manage money, and nothing it publishes is a recommendation to buy or sell any security.
Every research workspace stays one click away.
The platform's main navigation separates About, the S&P 500 Prediction, Market Calls, seven Market Terminals, Analytics, Model Consensus, Composite Score, News and Subscribe. Each workspace keeps its own purpose while the current market read remains visible across the platform.
Where the market sits, stated in advance.
The headline read for the S&P 500: where the market sits in its cycle, whether conditions are strengthening or weakening, and a year-end range with the probability attached to it — never a single number pretending to be a forecast.
Alongside it, two things most commentary never gives you: what the model is watching, and what would change the call.
Agreement and disagreement remain visible.
Model Consensus places every model reading and macro gauge on one page, then shows how each gauge behaved historically when a validated classifier fired. It is a research surface, not a signal, a forecast, or another classifier; only the four validated classifiers carry published precision.
Four signals, held apart from everything else.
Four models carry measured out-of-sample precision and are named wherever they appear: the Bear Regime Signal (BRS), two drawdown classifiers (MBS T1 and MBS T2), and the Recovery Signal (RRS). They are walk-forward validated — trained only on data available at the time of each call, never on the answer — and they are the only work on the platform covered by the independent validation and audit engagements.
They are held apart from everything else on the platform, deliberately. The line between a validated signal and a research finding is the one distinction the whole product rests on, and blurring it would cost more than it could ever sell.
What has actually followed a setup like this one.
What has actually followed a given setup — how often, against what baseline, and whether the sample is large enough to mean anything. Calendar and election-cycle effects tested rather than asserted. Index, sector, global, commodity and thematic readings, each measured against its own threshold.
These are not forecasts, and the platform says so on every one of them. They are the base rate you would be arguing against if you took the other side — which is the thing almost no market commentary gives you at all.
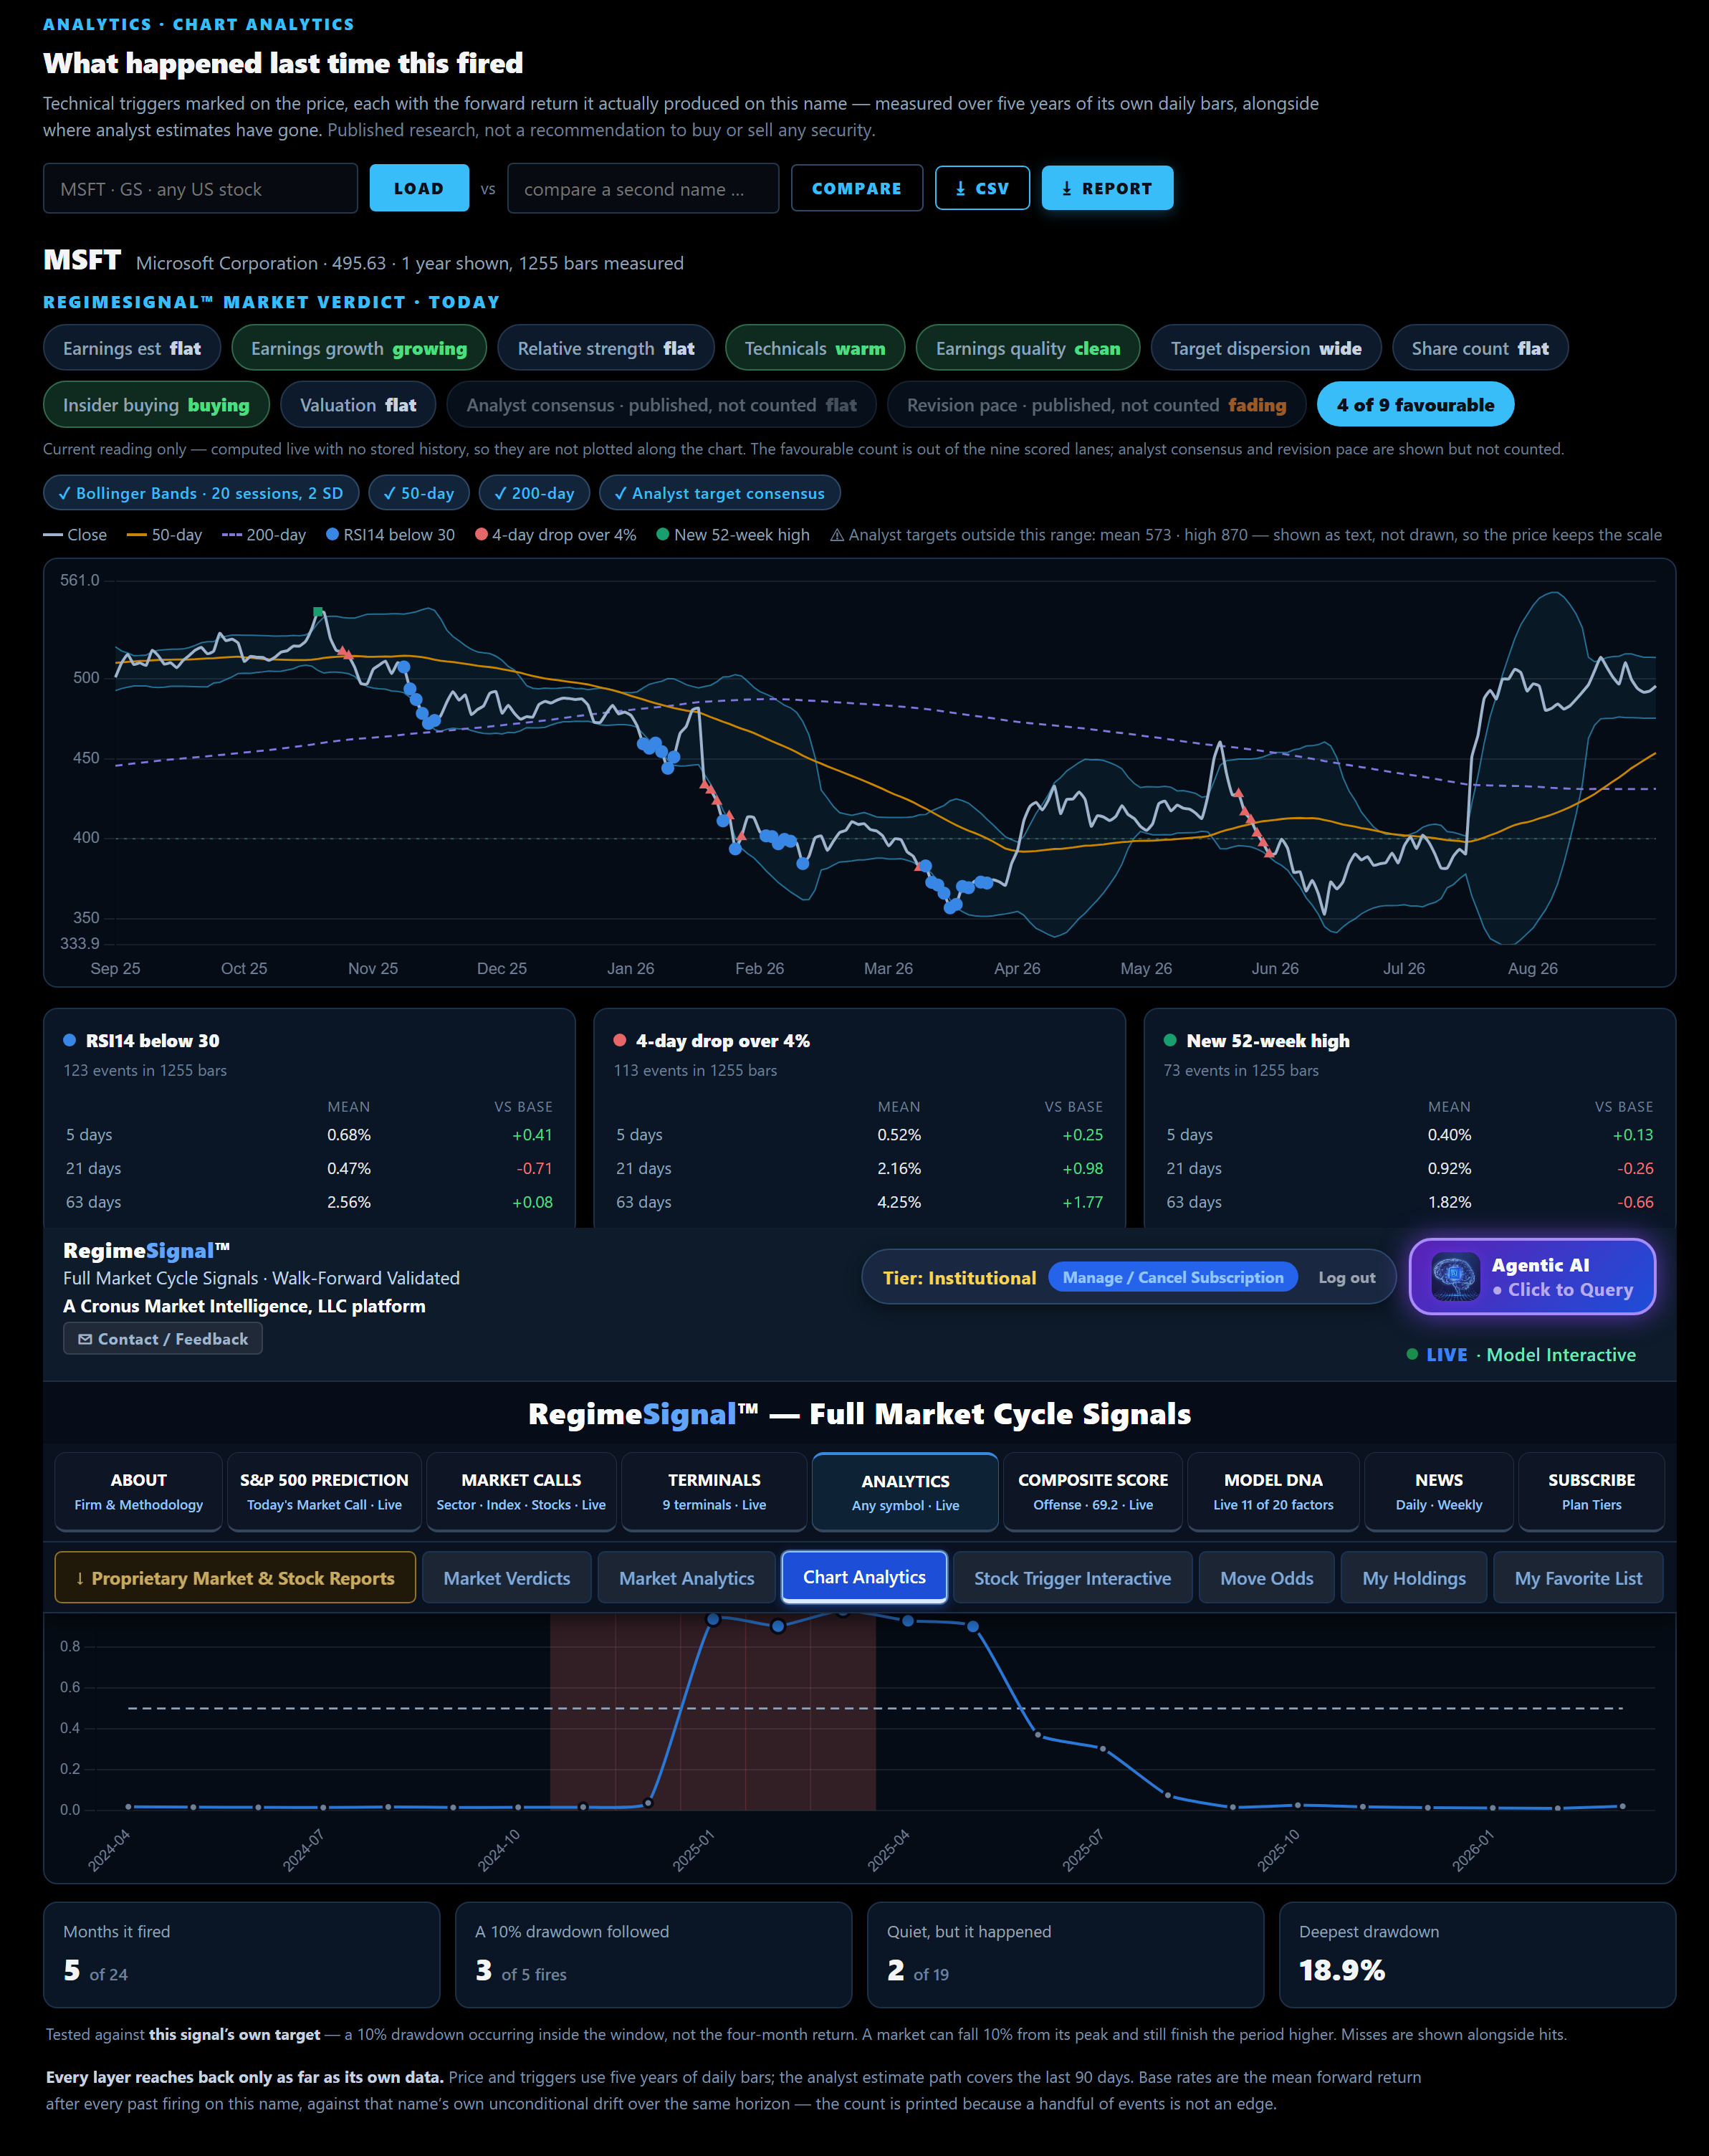
Each trigger marked on the price, with what actually followed on this name — and the baseline it has to beat.
Captured September 13, 2026.
Published research, not a recommendation to buy or sell any security. No trigger shown predicts anything.
Every measure stated separately, never blended.
Every name in the screened universe is read through independent measures — earnings estimates, earnings growth, relative strength, technicals, accounting quality, analyst dispersion, share issuance, insider activity, valuation.
They are never averaged into a single score. That is a deliberate choice: averaging hides the disagreement, and the disagreement is the information. A name where every measure agrees is a different proposition from one where half of them are pulling against each other, and a single blended number makes those two look identical.
- How much of the evidence agrees — offense, neutral or defense, with the count printed beside it so you can see what it rests on.
- Whether it is improving or weakening — which measure changed, and when.
- Whether that change was its own, or the whole market's.
That third reading is the one nothing else gives you. A measure that turned on a name the same day it turned across much of the board is market weather. The same measure turning on that name alone is news about that company. They look identical on a screener. They are not the same event, and the platform tells you which one you are looking at.
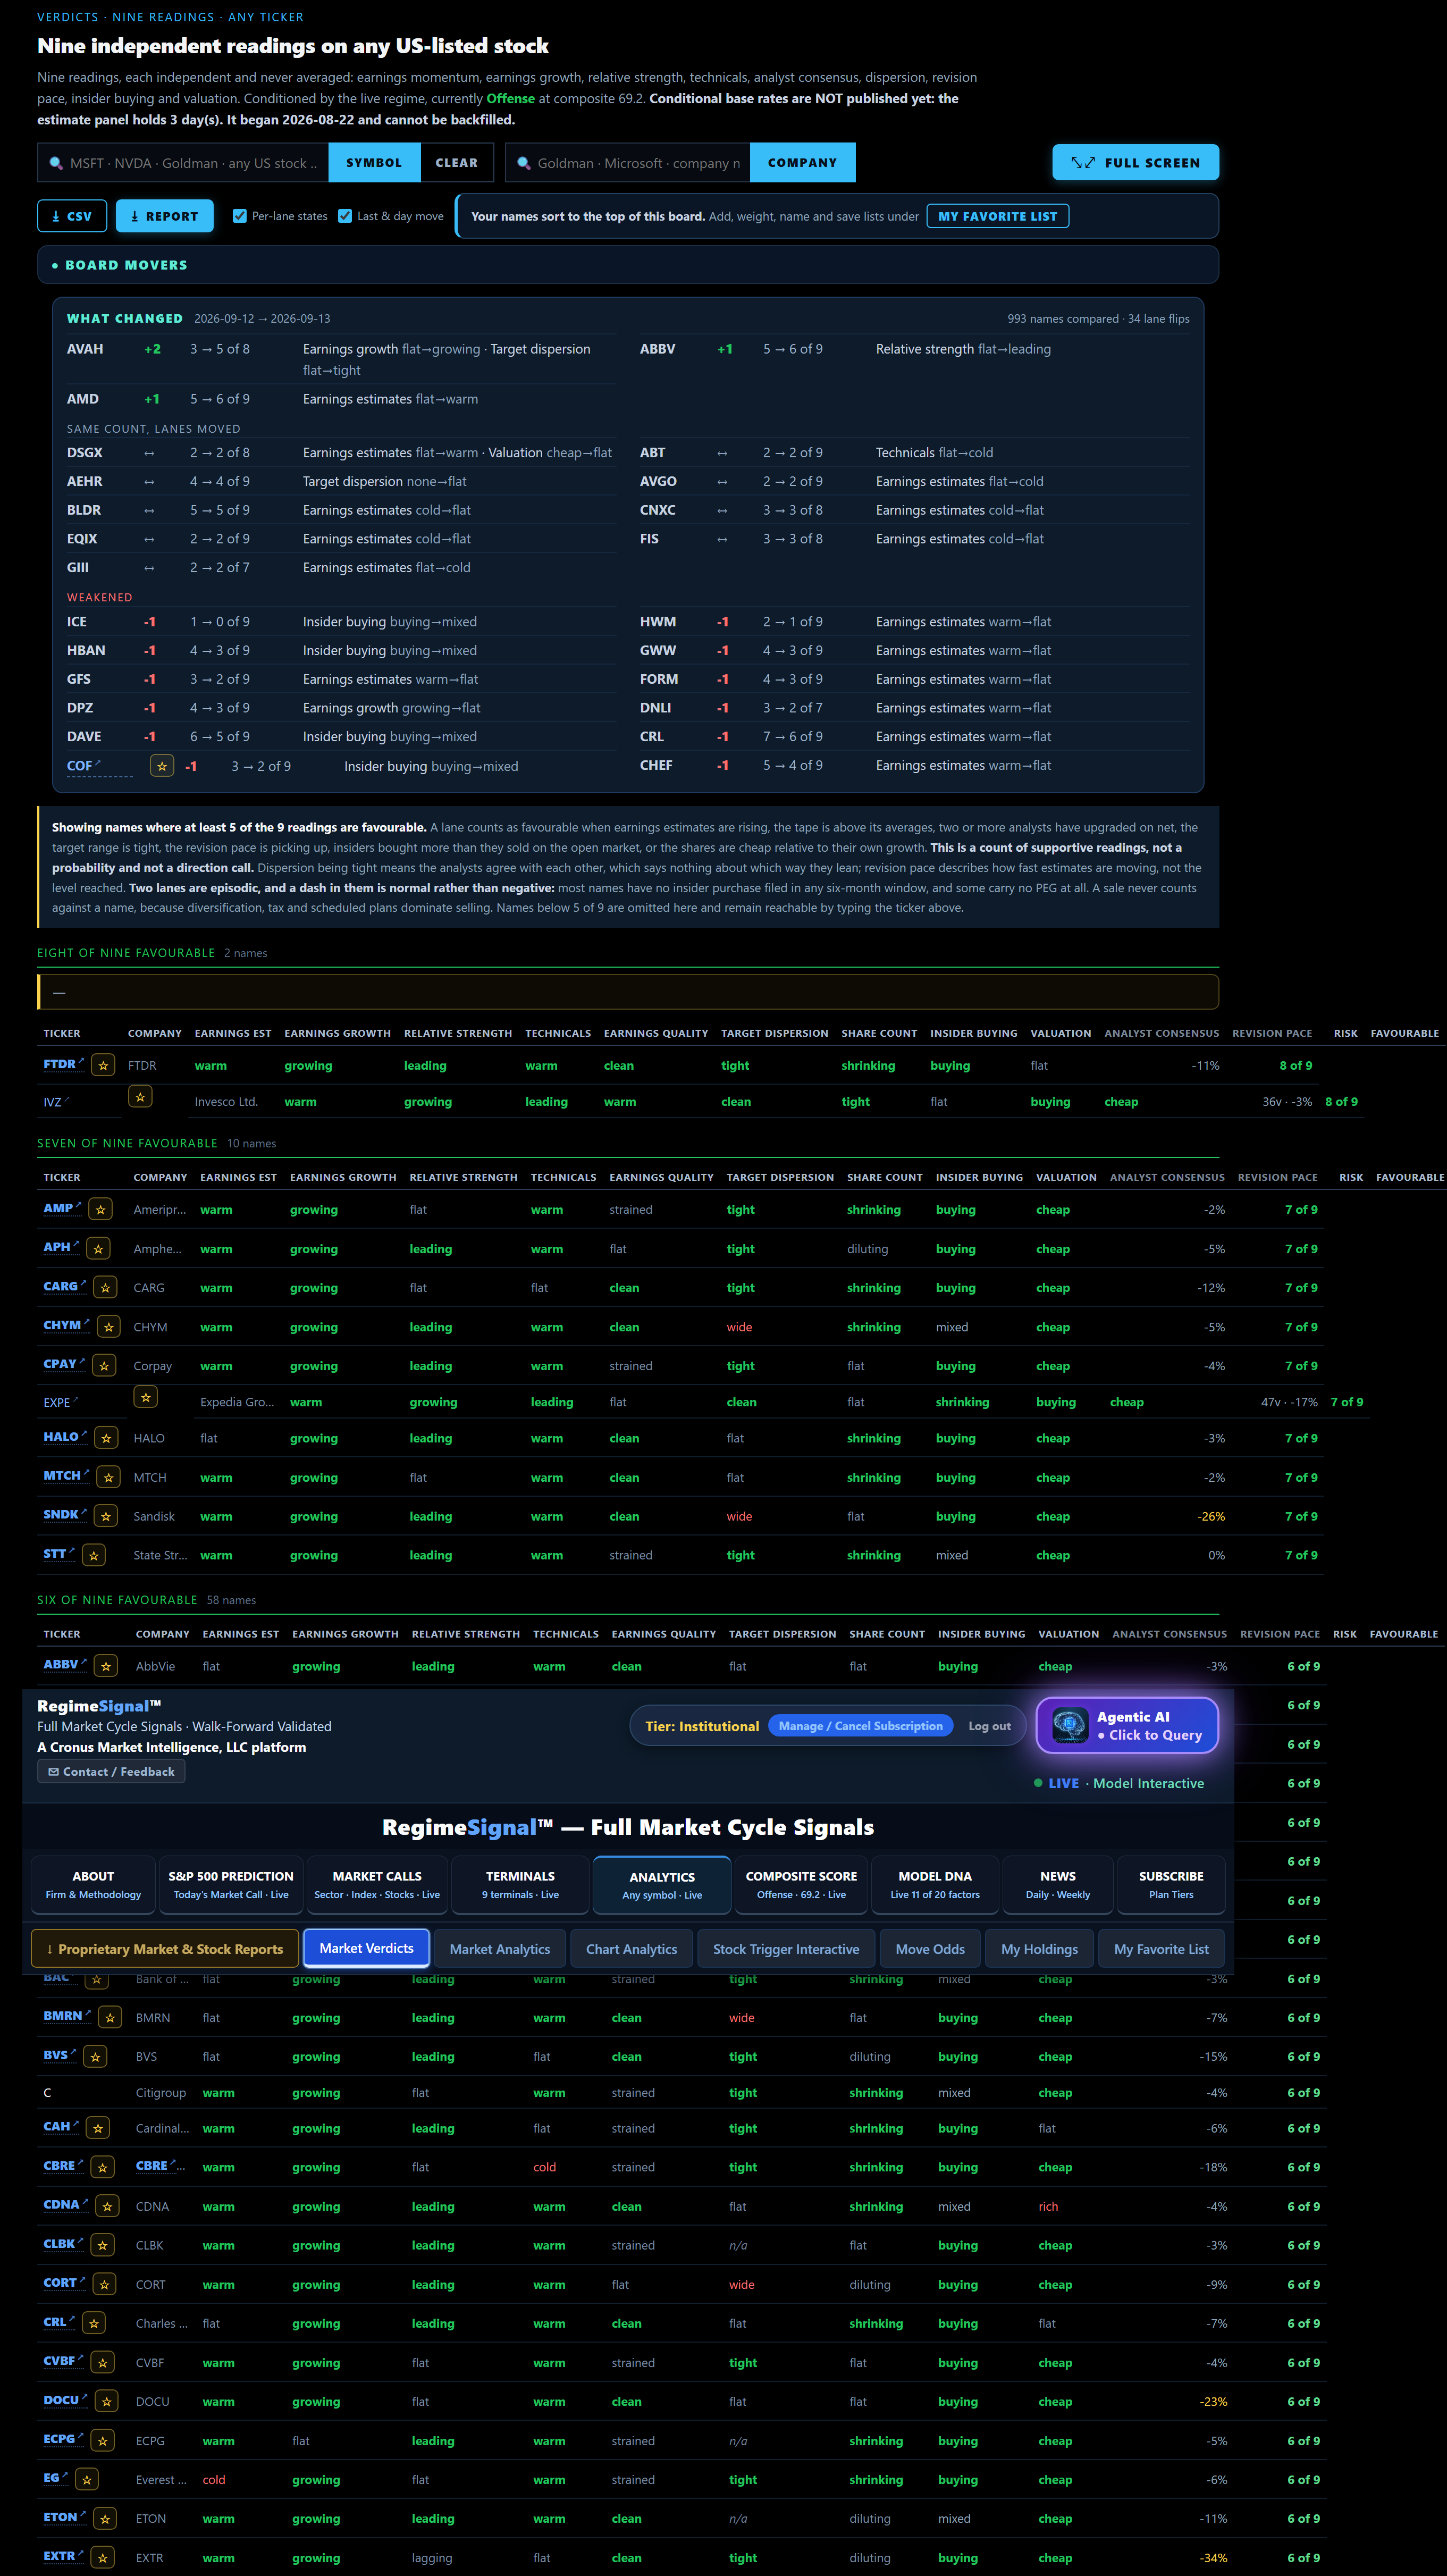
Every name, every measure, stated separately — and what changed since yesterday.
Captured September 13, 2026.
An evidence board, not a buy list. No recommendation to buy or sell any security.
Beyond the S&P 500.
Index coverage across the Americas, Europe/Middle East/Africa and Asia-Pacific, plus credit, metals, energy, crypto and FX — each with day, year-to-date, three-month and one-year change and a one-year trend line.
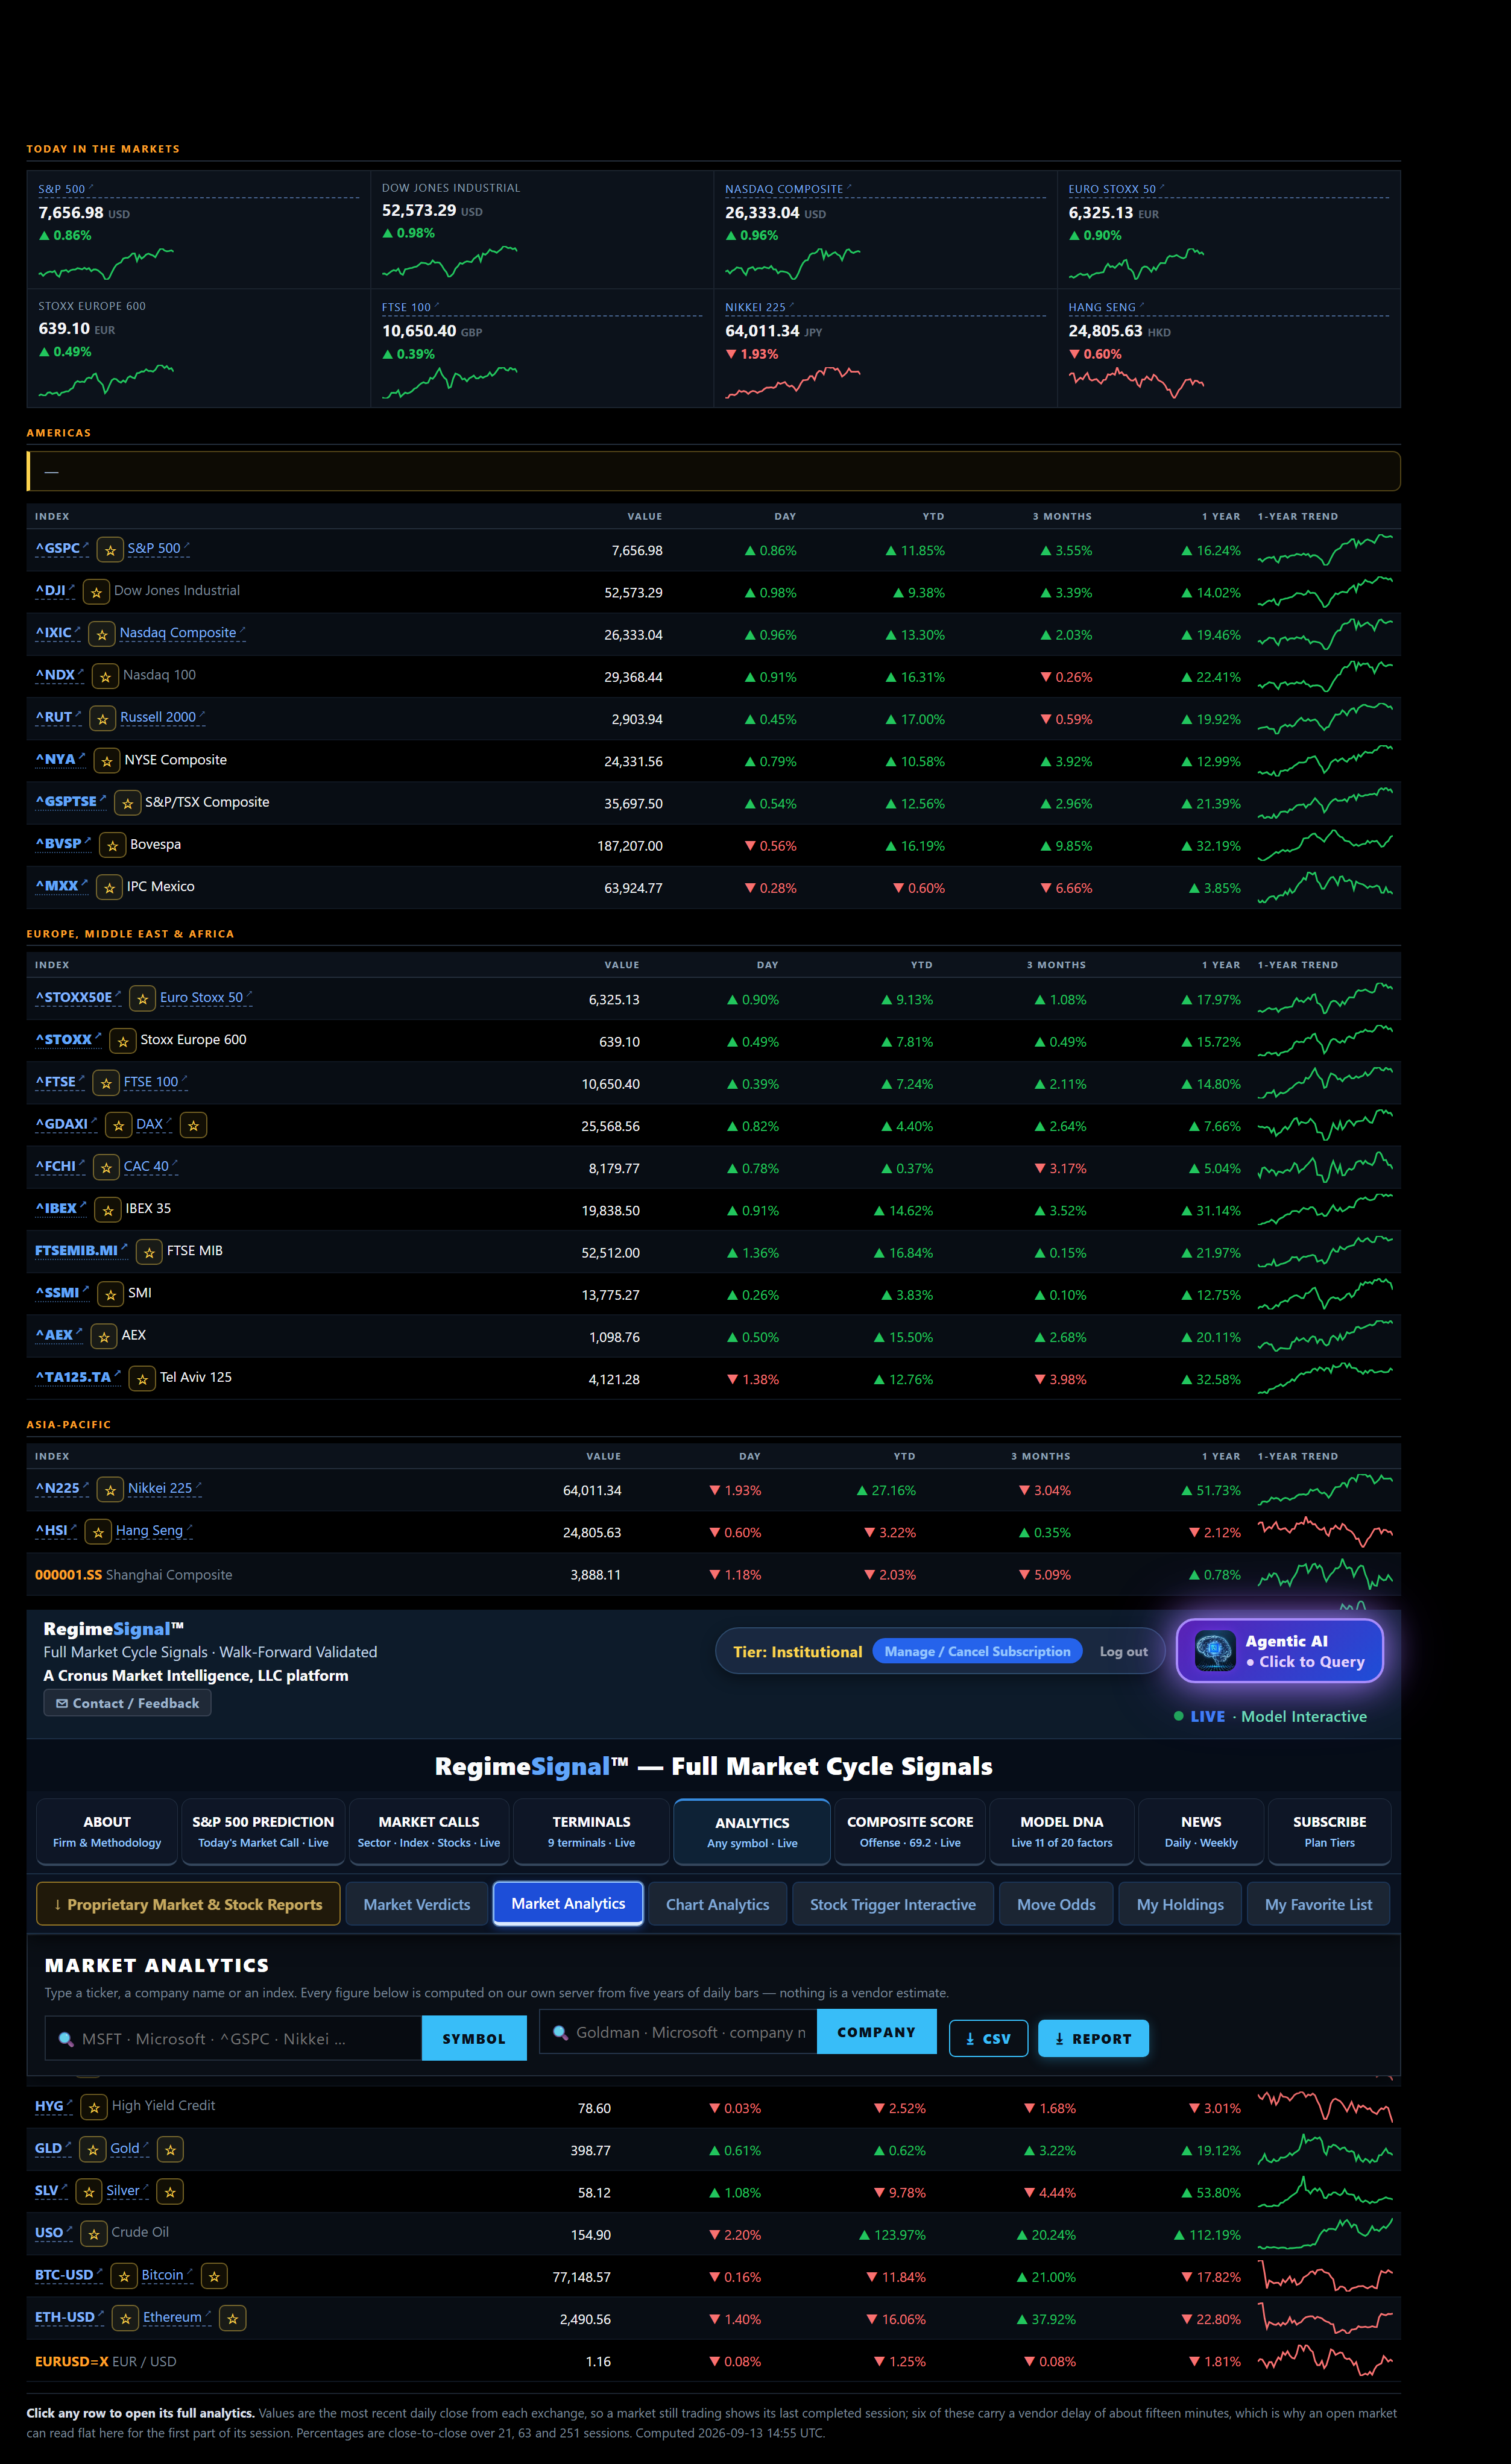
Coverage beyond the S&P 500, with the as-of time and the vendor delay stated on the page.
Captured September 13, 2026.
Values are the most recent completed session. Some rows carry a vendor delay of about fifteen minutes. Not real-time quotes.
How violently, not which way.
This is the one call on the platform that does not name a direction. It says how big, never which way.
It measures how often the following quarter delivered a move of more than ten percent in either direction, grouped by how far the instrument sat below its own running peak, counted across its entire price record.
The platform states plainly that the finding is suggestive rather than established, that the observations are not independent because drawdowns cluster in crises, and that no signal on the platform reads it.
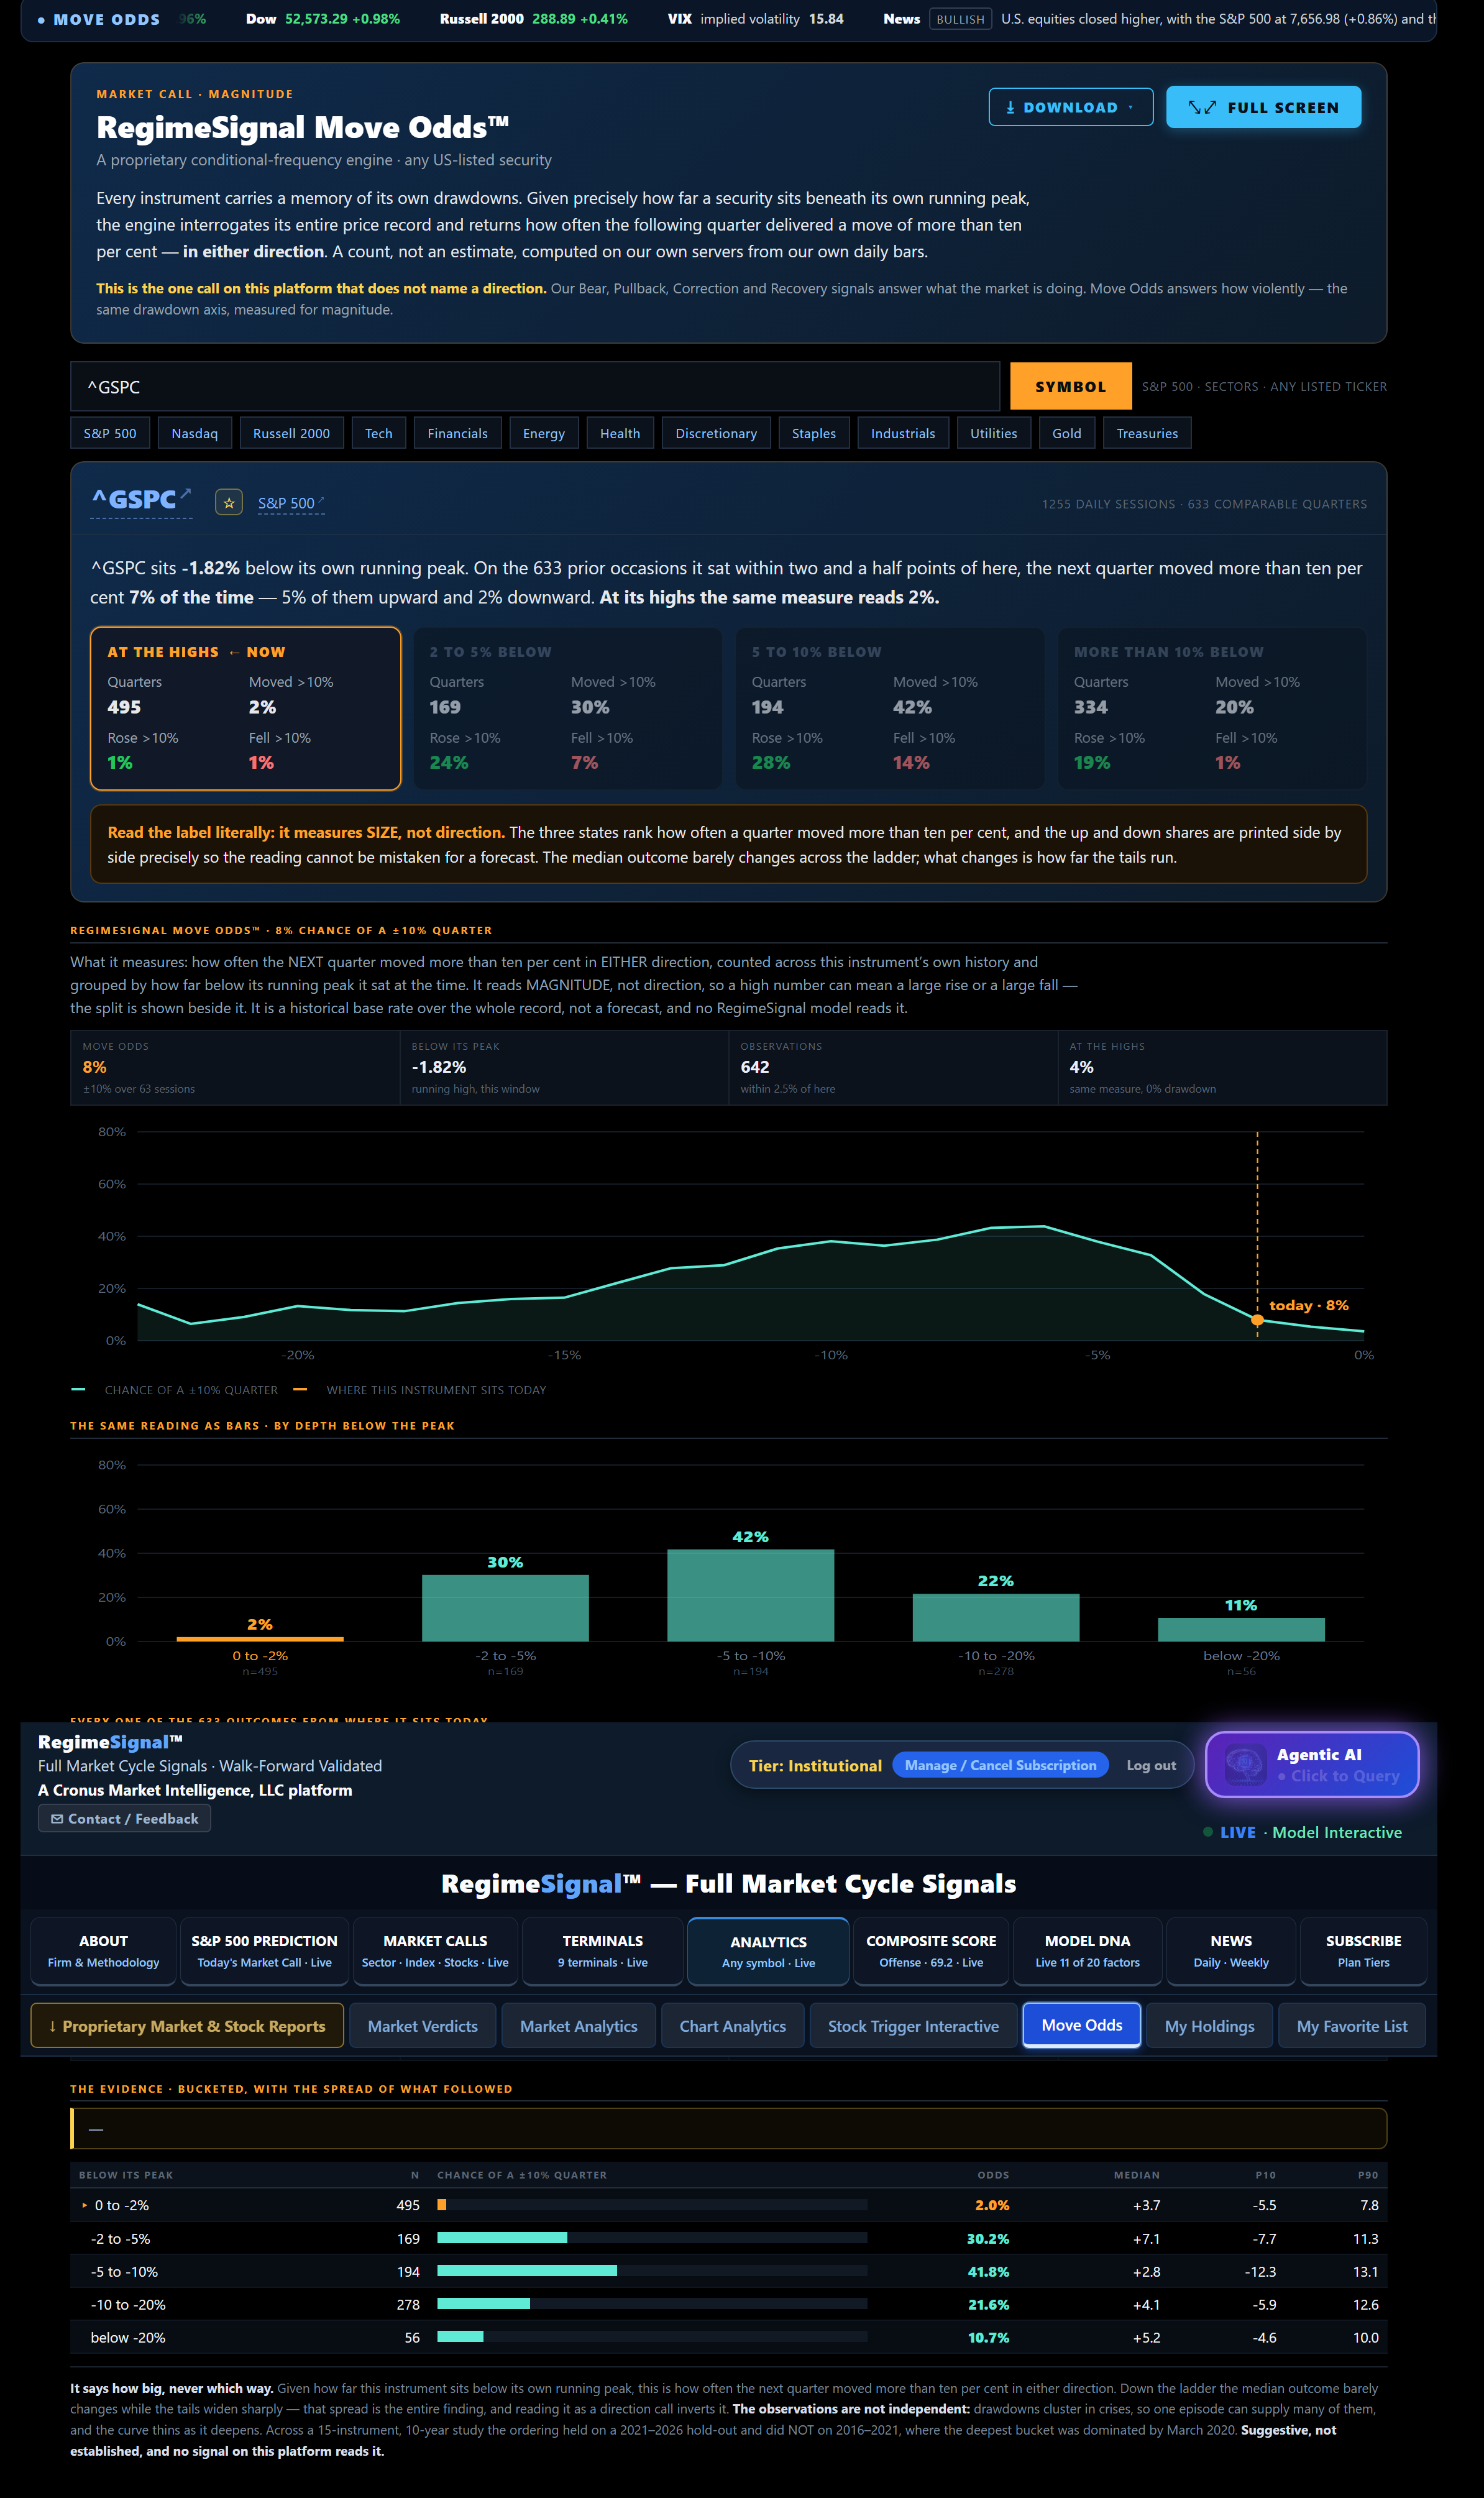
How violently, not which way. A count across the instrument's own history, not an estimate.
Captured September 13, 2026.
No direction, forecast or probability of a rise or fall is implied, and no RegimeSignal model reads it.
Also live on the platform
- Movement over time, not just today. The platform records when each measure changed on each name, which measure changed it, and how much of the whole board moved the same day. Price is charted with every one of those changes marked on it.
- Sector context per name. A company's sector earnings growth and margin against the index, plus that sector's own drawdown model.
- Downloadable written reports on every analytic page. Not a table dump: a document that explains what the figures mean, what would change them, and what they do not claim. Charts included.
- Earnings season tracking. Measured against FactSet, with each figure naming its basis and its as-of date.
- A live news feed. Filtered to market-relevant items, deduplicated across wire revisions of the same story.
Captures are dated photographs of the live platform taken September 13, 2026. Figures visible inside a capture are as of that date and are not claims about current coverage. RegimeSignal™ is a publisher of market research operated by Cronus Market Intelligence, LLC. It is not a registered investment adviser and does not provide personalized investment advice. Published research is informational only and is not a recommendation to buy or sell any security. Model results are historical and past results do not indicate future results.
What you get
What it's actually like once you're inside.
Beyond the methodology: this is the day-to-day of holding a RegimeSignal™ subscription.
A daily regime read
Sign in and the current reading is already there — where the four validated signals stand today, updated daily, with the prior reading alongside it so you can see what moved.
Plain-language change alerts
When a signal fires or a regime changes, you get told in words, not just a number — what fired, what it historically implies, and what it does not. Optional text alerts are opt-in inside your account.
Reads beyond the index
Sector, global index, single-name, commodity and thematic calls sit next to the S&P 500 read, so you see where risk is concentrating rather than only that it exists.
The full history, always open
Every past call, its date, and the reasoning behind it stay accessible in the terminals — so the record is auditable by you, not just quoted at you.
Terminal availability varies by plan. Compare what each plan includes →
Independently Validated & Audited
Two independent PhD-level reviews of RegimeSignal™'s four S&P 500 signals — both reaching "Validated with Qualifications."
Methodology
Disciplined. Validated. Continuously adapted.
No black boxes, no narrative overlays — just a transparent, evidence-driven framework refit on a fixed cadence.
Walk-forward validation
Every signal is constructed and tested under walk-forward protocols designed to mirror real-time decision-making — not curve-fit hindsight.
Expanding-window refits
Classifier models are refit on a regular cadence using expanding windows, so the framework can adapt as markets evolve without discarding cycle history.
AI-augmented, not AI-driven
Machine learning sharpens signal construction and gauge calibration. The methodology, regime definitions, and decision logic remain transparent and auditable.
What it's for
Built for forward-looking risk decisions.
Detect bear formations
Identify the conditions under which S&P 500 bull markets historically transition into bear regimes — before they price.
Anticipate drawdowns
Surface weakening internals during active bull markets, when corrections are most often ignored by consensus.
Confirm recoveries
Distinguish durable bull market recoveries from bear market rallies using signal-based confirmation, not narrative.
Forward-looking signal intelligence
8 for 8 — every financially-driven S&P 500 bear regime caught ahead of time (7 of 7 in walk-forward OOS + 1990 in pre-OOS training history).
Bear markets called in advance: 1990 · 2000 · 2007 · 2011 · 2015 · 2018 · 2022 · 2025
Walk-forward OOS validation window covers 2000–2025; the 1990 cycle sits in pre-OOS training history.
Bear regime detection
304 OOS months, 2000–2025
5%+ drawdown ahead
154 OOS months, 2013–2025
10%+ correction ahead
154 OOS months, 2013–2025
Bull recovery (+10%)
154 OOS months, 2013–2025
Within-bull weakening (directional gauge)⁶
47 OOS walk-forward
Within-bear exit (directional gauge)⁷
21 LOO-CV, COVID-dominated
COVID March 2020 excluded as exogenous (handled by the HybridBrain™ ERI overlay). Validation summary across the locked model suite.
Precision = share of fires followed by the predicted event within the model's forward window. OOS = out-of-sample (walk-forward); LOO-CV = leave-one-out cross-validation. Past market signal record does not guarantee future results.
5 Directional engines (not formal signals): BWS — 47 OOS months, AUC 0.67, threshold ≥ 0.70, within-BULL only — powers Bull Velocity. BES — 21 LOO-CV BEAR months, threshold ≥ 0.55, within-BEAR only — powers Bear Velocity. BHT — descriptive 0–100 companion to Bull Velocity, calibrated against 310 clean bull months (1993–2026); inherits the BWS validation profile. PRG — within-NEUTRAL composite of MBS T1, MBS T2, BRS distance-to-bear, and news flow; components walk-forward validated (footnotes 1–3), composite weighting is not. RDG — within-RECOVERY composite of RRS, BES slope, BRS exit, SPX/200dma, HY OAS; components from validated signals (footnotes 1, 4) plus BES, composite weighting is not. ⚠ All five excluded from the formal 4-signal count — disclosed honestly.
Across the full cycle
Coverage from pullback to bear to recovery.
Each cycle state has a dedicated signal. Bull Velocity and Bear Velocity provide directional context within each regime.
Pullback
−5%
Neutral state trigger
Correction
−10%
Underperform trigger
Bear Market
−20%
Bear Alert · regime classifier fires
Recovery
+10%
Bull-market recovery confirmed
Bull Velocity surfaces within-bull weakening · Bear Velocity tracks within-bear intensity
Straight answers
The questions people ask first.
Isn't this just hindsight — looking backward and saying you called it?
+
No. The signals are walk-forward validated, meaning each call is generated using only data available before that date, then scored afterwards. The methodology has also been independently reviewed and audited by an outside PhD.
What happens when a signal is wrong?
+
It stays in the record. Every call is dated and kept in the platform, including the misses, and the published precision figures are stated with their limitations rather than rounded up. No model is right every time and we do not present one as if it were.
Who is actually behind this?
+
Cronus Market Intelligence, LLC, a research firm based in Santa Barbara, California. The framework was developed by an Economics/MBA/CFA Charterholder.
Is this financial advice?
+
No. RegimeSignal™ is a market intelligence and research product. It is not investment advice, not a recommendation to buy or sell any security, and Cronus is not a registered investment adviser.
How do the readings reach me?
+
The terminals live in your browser on desktop, laptop and tablet — no download required — and update daily. Text alerts are available as a separate opt-in inside your account settings.
What does the 7-day free trial include?
+
Full platform access for seven days, including the four validated signals and the Market Calls terminals. A card is required at checkout, but you can cancel anytime before the trial ends.
What is the difference between a validated signal and a Market Call?
+
The four validated signals (BRS, MBS T1, MBS T2, RRS) have been walk-forward validated and independently audited. Market Calls are informational research outputs — useful context, but not part of the validated signal layer.
More detail on the full FAQ and in the disclosures.
Early warning, before consensus.
The RegimeSignal™ framework — four walk-forward validated prediction signals and Bull / Bear Velocity gauges for the S&P 500. Take a free 15-minute look inside the live model, or start your 7-day free trial today.
1 RegimeSignal™ has been independently PhD-validated and audited: both concluded the bear (BRS), pullback (MBS T1), and correction (MBS T2) signals reproduced and matched their locked out-of-sample results, with the qualifications centering on the recovery signal (RRS) — hence, Validated with Qualifications. Both PhD reviews are made available to subscribers. See Disclosures.